This is archived content, mostly untouched since 2003. For newer
content/updated versions, see
netfuture.ch/Publications.
Notes:
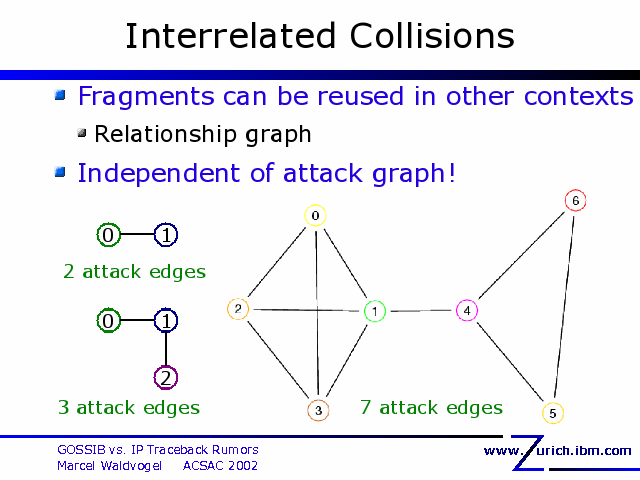
On this and the next slide, the graphs do not show a network of fake and
real attack edges, instead they depict the relationship between the fake
edges. They visualize how you can get down to about 3 fragments per fake
edge, while real routers need 8 fragments to reach the victim to notify it
of a particular "true" edge.
On these two slides, circles represent the actual fake edge an attacker
wants to introduce, while the links between the circles signify sharing of
fragments.
On this page, you can assume each link to represent the sharing of five
fragments, pairs with less sharing are not indicated. The left-hand side
shows the most frequent occurences, namely pairs and the triples listed on
the previous page. On the right-hand side, we have a randomly selected
example with 7 edges. You can see that the left and right halves of the
graphs are fully interconnected, which can be taken as a good first
indication of the resilience against fragment loss.
As we will see on the next page, often, there are also other links involved
where fewer fragments are shared.